Vasaloppet
This weekend I decided to play around and try to do some web scraping. I had never done it before, but it had been on my to-do list for a long time (I just had never gotten around to it). However, this week I found the perfect excuse—Vasaloppet.
Some background. Vasaloppet is a 90km long cross-country skiing competition in Sweden. It that has been held annually since 1922, in comemoration of King Gustaf Vasa who is said to have made this journey in 1520 while fleeing from Danish invaders. From its beginning almost a century ago, it has grown into a massive event, attracting participants from all over the world (in 1922 there were 117 skiers, this year there were over 10,000).
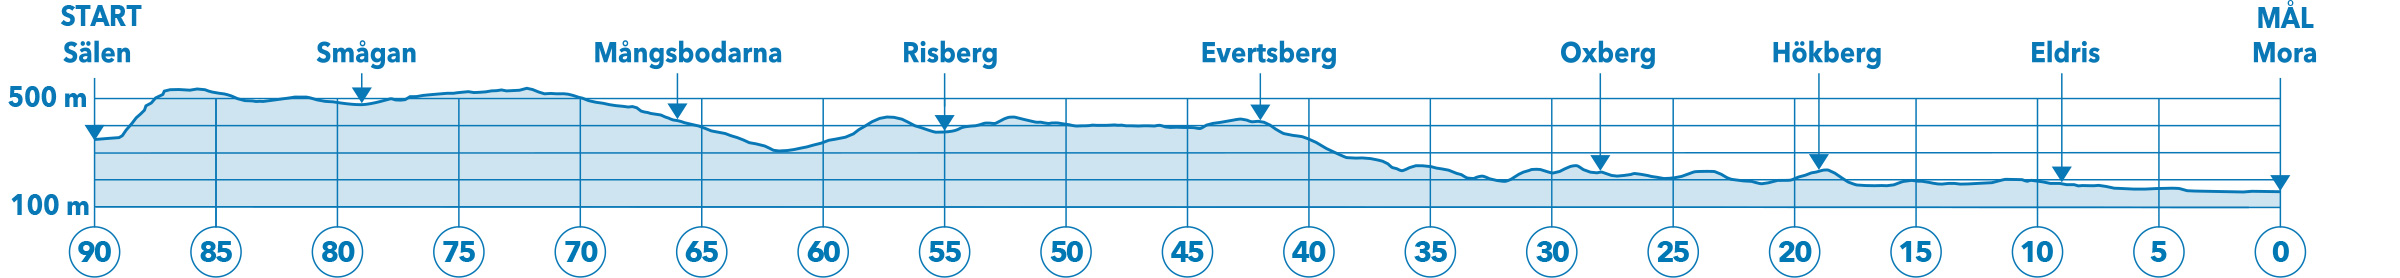
Figure 1: Elevation of the race course
Anyhow, on the website of Vasaloppet they have a nice database with results from all the races since its beginning. The data include data on all participants, including stop-times at the different check-points along the way, their official ranking, which country they are from, age group, etc.
My first idea was to scrape this database and do some cool visualization. Unfortunately, it turned out to be a somewhat larger project than I had anticipated. So with this year’s race running live on the TV in the background, I ended up scraping the Wikipedia page listing all the winners instead.
Here are the results.
## Warning: as.hms() is deprecated, please use as_hms().
## This warning is displayed once per session.
## `geom_smooth()` using formula 'y ~ x'
Some comments.
There was one woman participating in the race of 1923. After that women were not allowed to compete until 1981 as it was deemed “to tough” for them. As we can see from the plot, however, the have caught up well and are not very far behind the men.
The race has been arranged every year but three since 1922 (it was cancelled in 1932, 1934, and 1990; masked out in the plot).
There is a large variation in finishing time year-to-year. My suspicion is that it is related to weather.
Over time there is a downward trend, showing that that the winners—in general—have become faster. As expected, though, the curve has leveled off as it gets harder and harder to push the record time.
This is only a simple example, and there are lot of other possibilities to explore. For example, I would like to explore the weather hypothesis by downloading some weather data, perhaps from SMHI, or take a look at stop-times and relate this to the elevation information in Figure 1.
I hope to update this post with more fun stuff in the future.


